 Catalogue PIGMA
25 km
Type of resources
Available actions
Topics
Keywords
Contact for the resource
Provided by
Years
Formats
Representation types
Update frequencies
status
Scale
Resolution
-
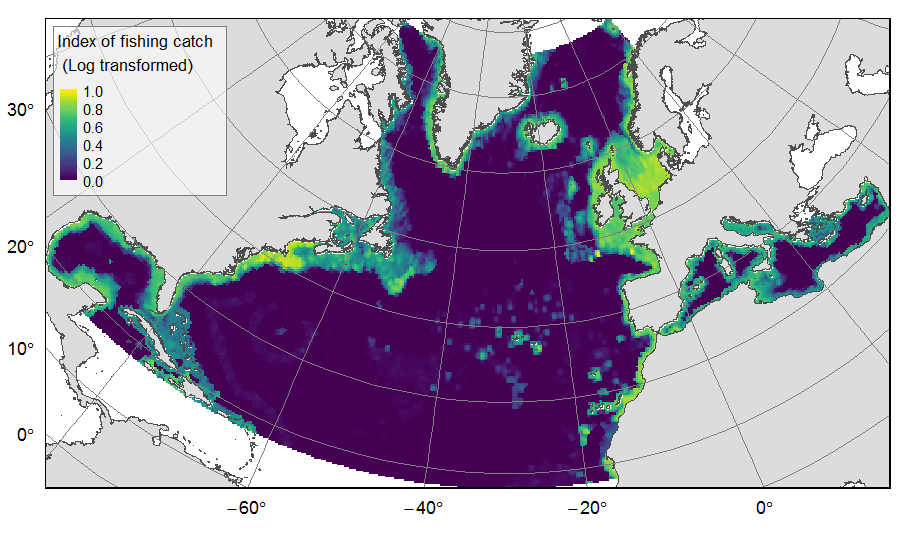
Distribution of catch from deep-sea impacting fishing on the North Atlantic (18°N to 76°N and 36°E to 98°W), for the period 2010-2015. The average of yearly fishing catch for the period 2010-2015 is displayed as an index on the ATLAS grid of 25km * 25km resolution. Source data originated from the Global Fisheries Landings V4.0 database. The dataset was filtered to select only the fishing gears that have an impact on large areas of the seafloor (dredges, bottom trawls, and Danish seines). Within each cell, all remaining catch records were summed to get the total catch rate of the considered year. This dataset was built to feed a basin-wide spatial conservation planning exercise, targeting the deep sea of the North Atlantic. The goal of this approach was to identify conservation priority areas for Vulnerable Marine Ecosystems (VMEs) and deep fish species, based on the distribution of species and habitats, human activities and current spatial management.
-
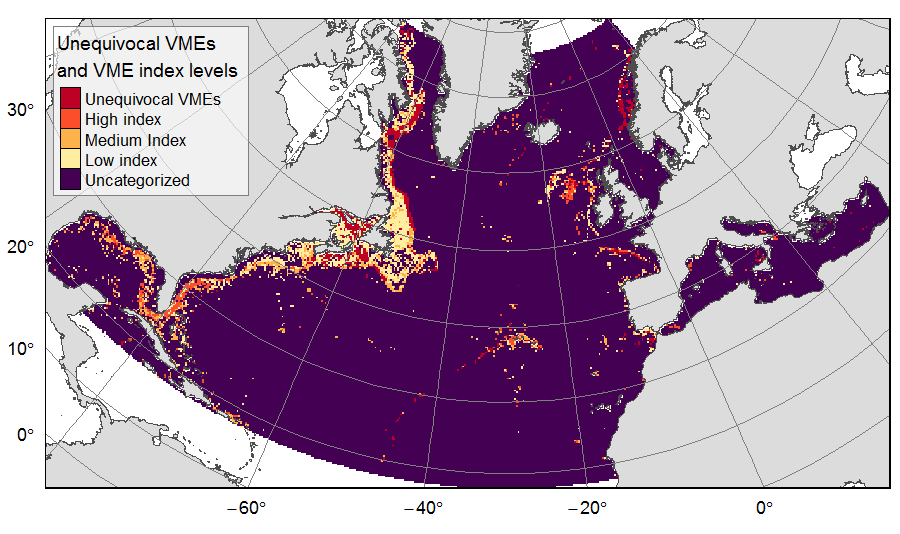
Distribution of unequivocal Vulnerable Marine Ecosystems (VMEs) and VME likelihood based on indicator taxa records, on the North Atlantic (18°N to 76°N and 36°E to 98°W). Several datasets, originating from public databases, literature review and data call to ATLAS partners, were gathered to compute the presence of unequivocal VME habitats in 25km * 25 km cells for the ATLAS work package 3. One layer displays the unequivocal VMEs (value=4) and the assigned high (value=3), medium (value=2) or low (value=1) likelihood of gridsquares to host VMEs, indexed on indicator taxa records from public databases with the method detailed in Morato et al (2018). The second displays the confidence associated to the VME likelihood score, indexed on data quality as detailed in Morato et al (2018) (values for unequivocal VMEs thus 100% confidence=4; high confidence=3; medium confidence=2; low confidence=1). This dataset was built to feed a basin-wide spatial conservation planning exercise, targeting the deep sea of the North Atlantic. The goal of this approach was to identify conservation priority areas for Vulnerable Marine Ecosystems (VMEs) and deep fish species, based on the distribution of species and habitats, human activities and current spatial management.
-
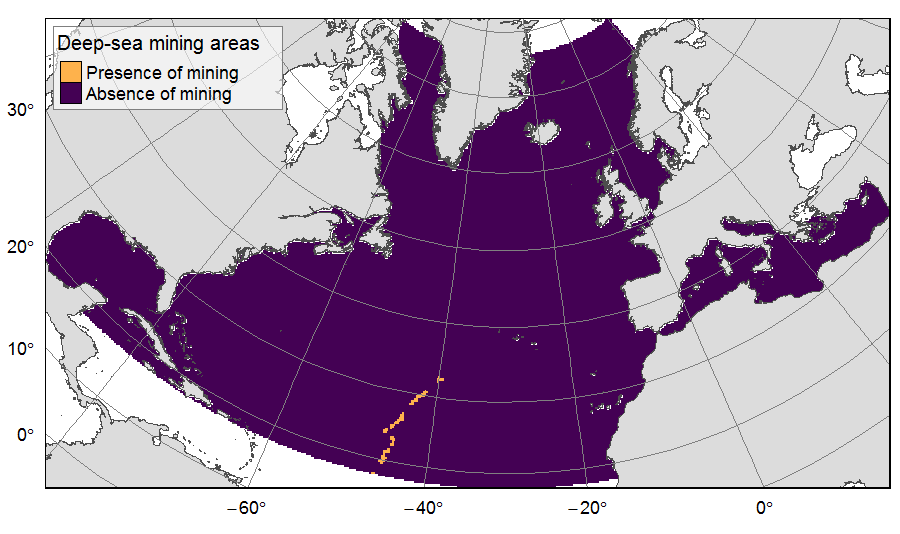
Presence of deep-sea mining exploration zones on the North Atlantic (18°N to 76°N and 36°E to 98°W). These areas correspond to the three polymetallic sulphides exploration contracts on the Mid-Atlantic Ridge, attributed to Poland, France and Russia. Each of the three contract areas is divided into 100 squares of 10km by 10km. Source polygons originated from the International Seabed Authority. The presence (value=1) of deep-sea mining was extracted in 25km * 25km gridsquares. This dataset was built to feed a basin-wide spatial conservation planning exercise, targeting the deep sea of the North Atlantic. The goal of this approach was to identify conservation priority areas for Vulnerable Marine Ecosystems (VMEs) and deep fish species, based on the distribution of species and habitats, human activities and current spatial management.
-
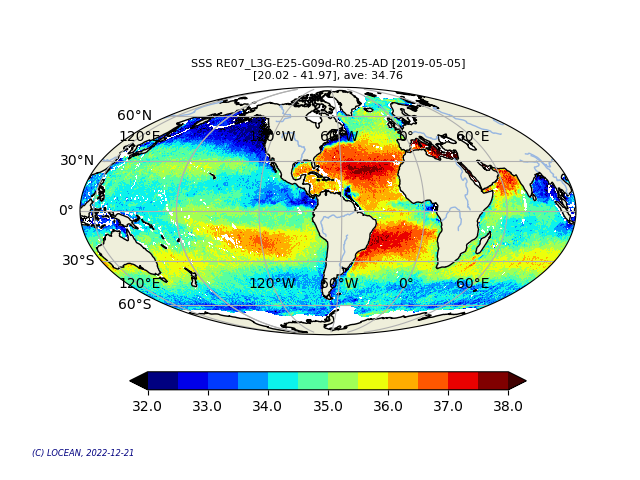
This product contains daily salinity fields from a 9 days temporal gaussian average, corrected from land-sea contamination and latitudinal bias, based on L2Q products, mixing ascending and descending orbits. The base products, for all the CATDS-PDC (Centre Aval de Traitement des Données SMOS - Production & Dissemination Center) processing chains, are the SMOS L1B products from ESA (European Space Agency). From these, brightness temperatures at various incidence angles are reconstructed. The Sea Surface Salinity (SSS) are retrieved from multi-angular brightness temperatures through a maximum likehood Bayesian approach in which measured Tb and Tb simulated using a forward direct model are compared (see Zine et al. 2008 for a general description of the retrieval method, and pro_con table for a summary of the similarities/differences with respect to ESA level 2 ocean salinity processing). Products from reprocessing RE07 are available for the period 02/2010 - 05/2021. Products from operational (OPER) processing are available since 06/2021. Reprocessed products and operational products are derived using the same algorithm and configuration, hence ensuring the temporal continuity.
-
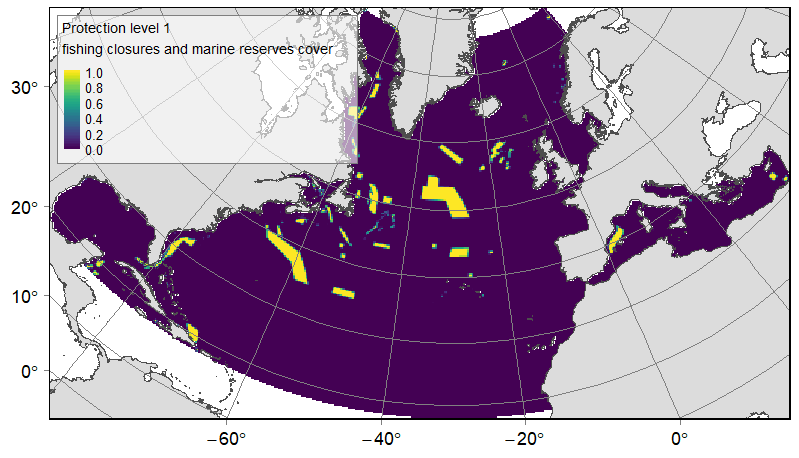
Distribution of three categories of protected or significant areas on the North Atlantic (18°N to 76°N and 36°E to 98°W). Categories were delineated according to relative levels of protection, from the highest to the lowest: fishing closures implemented by Regional Fisheries Management Organisations (RFMOs) and marine reserves; other MPAs likely to benefit from a lower protection; and Ecologically or Biologically Significant Marine Areas (EBSAs). Source vector data originated from the RFMOs (NAFO, NEAFC and GFCM), the World Database on Protected Areas (WDPA), national MPAs databases (US: NOAA and SAFMC; Canada: Fisheries and Oceans Canada; Norway: Institute of Marine Research) and the CBD website. The relative cover or each protection category on 25km *25km gridsquares was computed. This dataset was built to feed a basin-wide spatial conservation planning exercise, targeting the deep sea of the North Atlantic. The goal of this approach was to identify conservation priority areas for Vulnerable Marine Ecosystems (VMEs) and deep fish species, based on the distribution of species and habitats, human activities and current spatial management.
-
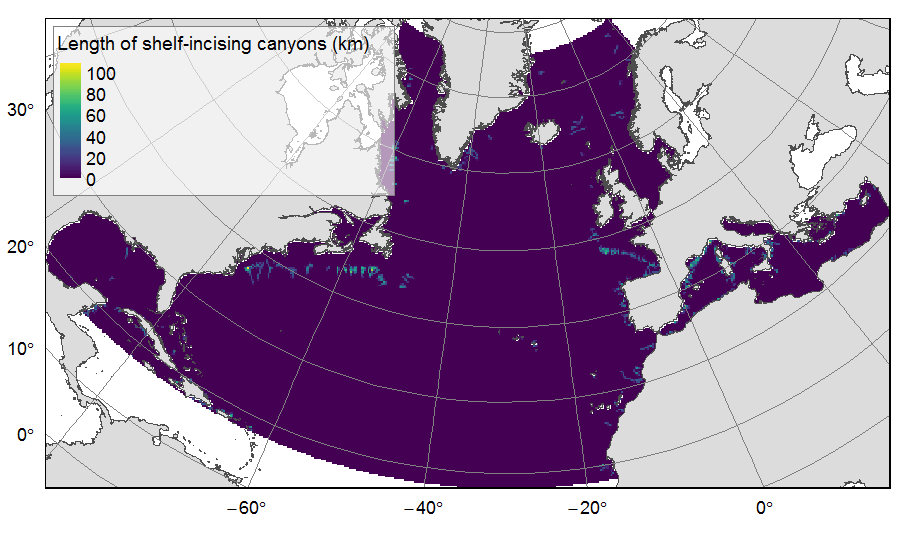
Distribution of three geomorphologic features (fracture zones, canyons, and seamounts) on the North Atlantic (18°N to 76°N and 36°E to 98°W). Source vector data originated from the GEBCO Gazetteer of Undersea Features Names for fractures, Harris & Whiteway (2011) for canyons, and Yesson et al. (2011) for seamounts. The presence (value=1) of fracture zones or seamounts and the total length of canyons (in km, independently for shelf-incising or blind canyons) was extracted in 25km * 25km gridsquares. This dataset was built to feed a basin-wide spatial conservation planning exercise, targeting the deep sea of the North Atlantic. The goal of this approach was to identify conservation priority areas for Vulnerable Marine Ecosystems (VMEs) and deep fish species, based on the distribution of species and habitats, human activities and current spatial management.
-
This product contains weekly salinity field, based on SMOS satellite data, and ISAS (In-Situ Analysis System). The L4OS SMOS-OI product contains global Level 4 analyses of the of the Sea Surface Salinity (SSS), Sea Surface Density (SSD) and Sea Surface Spiciness (SSSp), along with Sea Surface Absolute Salinity (SSA), Conservative Temperature (SCT), surface thermal expansion coefficient (alpha) and haline contraction coefficient (beta). The SSS product is obtained using an optimal interpolation (OI) algorithm, that combines ISAS in situ SSS OI analyses and Soil Moisture Ocean Salinity (SMOS) satellite image to reduce large scale and temporally varying bias. The SSS L4 product outcome is then combined with satellite SST products to compute thermodynamic sea water parameters using TEOS-10 (Kolodziejczyk et al., 2021). Products from reprocessing RE07 are available for the period 01/2011 - 05/2021. Products from operational (OPER) processing are available since 06/2021. Reprocessed products and operational products are derived using the same algorithm and configuration, hence ensuring the temporal continuity. The base products, for all the CATDS-PDC (Centre Aval de Traitement des Données SMOS - Production & Dissemination Center) processing chains, are the SMOS L1B products from ESA (European Space Agency). From these, brightness temperatures at various incidence angles are reconstructed. The Sea Surface Salinity (SSS) are retrieved from multi-angular brightness temperatures through a maximum likehood Bayesian approach in which measured Tb and Tb simulated using a forward direct model are compared (see Zine et al. 2008 for a general description of the retrieval method, and pro_con table for a summary of the similarities/differences with respect to ESA level 2 ocean salinity processing).
-
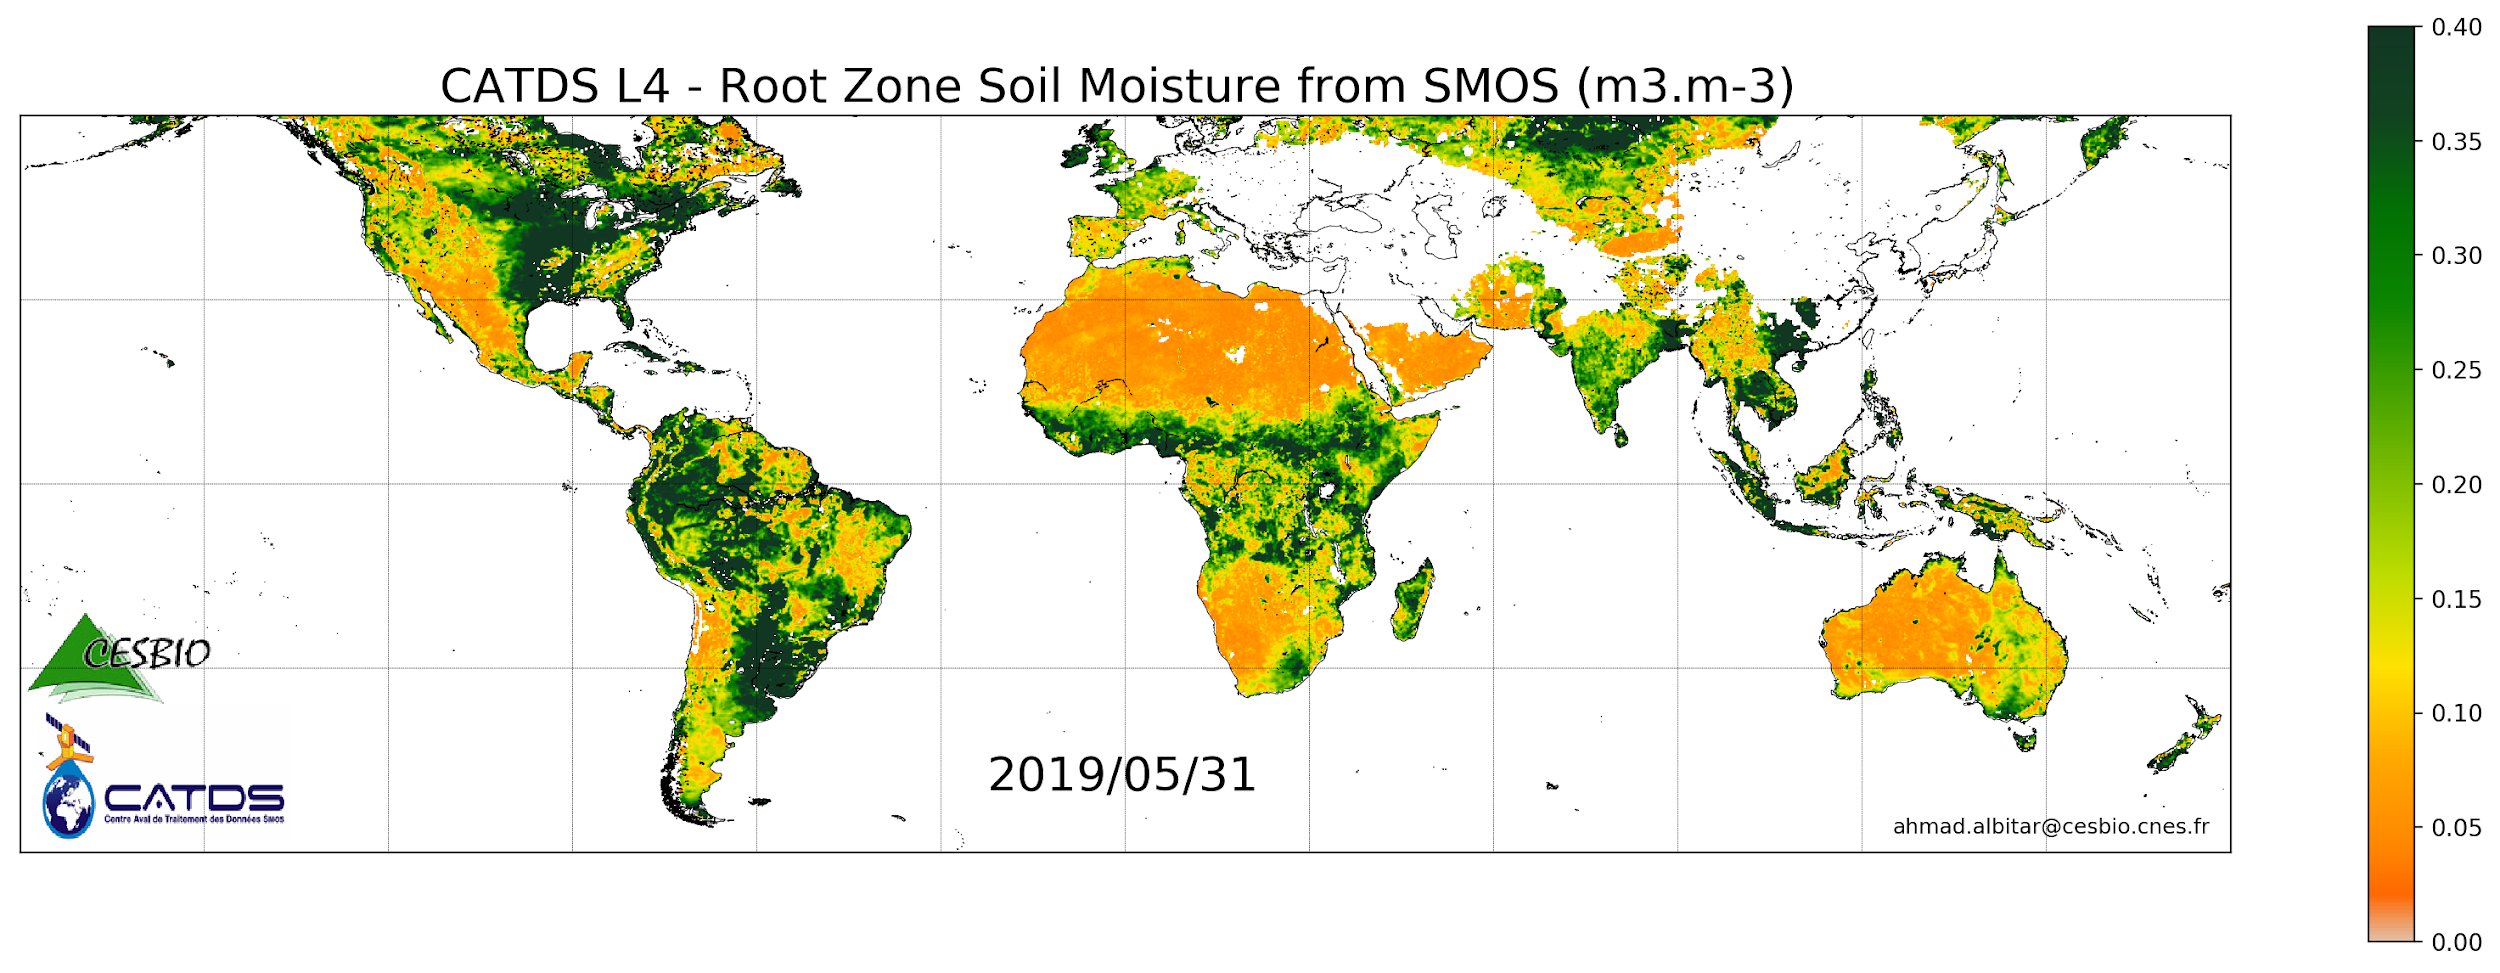
This product is a daily product of root zone soil moisture representative of the 0-1 m depth of the soil. The base products, for all the CATDS-PDC (Centre Aval de Traitement des Données SMOS - Production & Dissemination Center) processing chains, are the SMOS L1B products from ESA (European Space Agency). The L4SM RZSM is the daily product of root zone soil moisture (m3/m3) representative of the 0-1 m depth of the soil. The product contains also a quality index taking into account the presence of Radio Frequency Interference (RFI), low quality of retrieval of the input surface soil moisture, and a high fraction of non-nominal surfaces. Products from reprocessing RE07 are available for the period 01/2010 - 05/2021. Products from operational (OPER) processing are available since 06/2021. Reprocessed products and operational products are derived using the same algorithm and configuration, hence ensuring the temporal continuity.
-
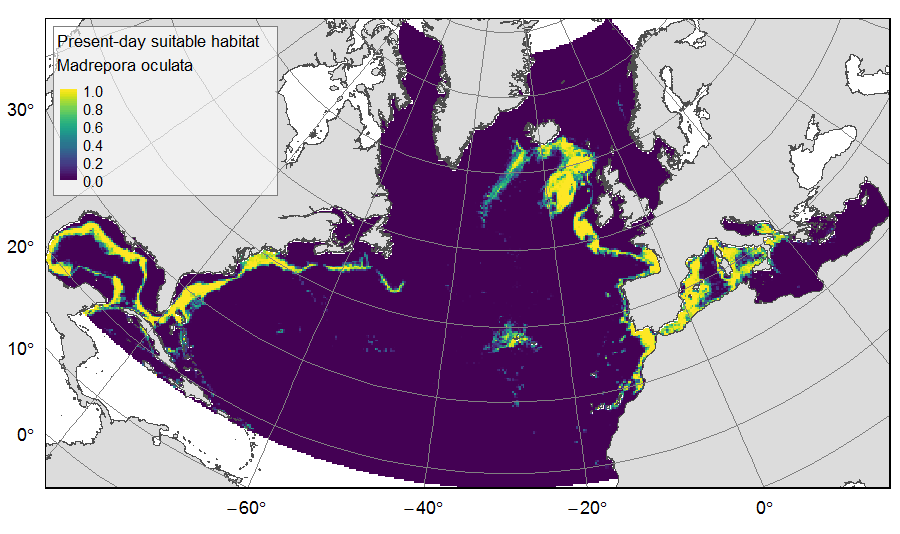
Distribution of predicted suitable habitat for six cold-water-coral, six deep-water fish and one sponge species, on the North Atlantic (18°N to 76°N and 36°E to 98°W). For each species, predicted habitat distribution was obtained for present-day conditions (1951-2000) and for the future climate refugias, i.e. the areas that were predicted as suitable both for present-day and forecasted future (2081-2010) conditions. The dataset gathers 26 raster layers created on the same grid of 25km * 25km resolution, downgraded from source layers (3km *3km resolution) that were created within the work package 3 of EU ATLAS project. The presence (value=1) of climate refugia and the relative cover (value ranging from 0 to 1) of present-day suitable habitat was extracted in gridsquares. This dataset was built to feed a basin-wide spatial conservation planning exercise, targeting the deep sea of the North Atlantic. The goal of this approach was to identify conservation priority areas for Vulnerable Marine Ecosystems (VMEs) and deep fish species, based on the distribution of species and habitats, human activities and current spatial management.
-
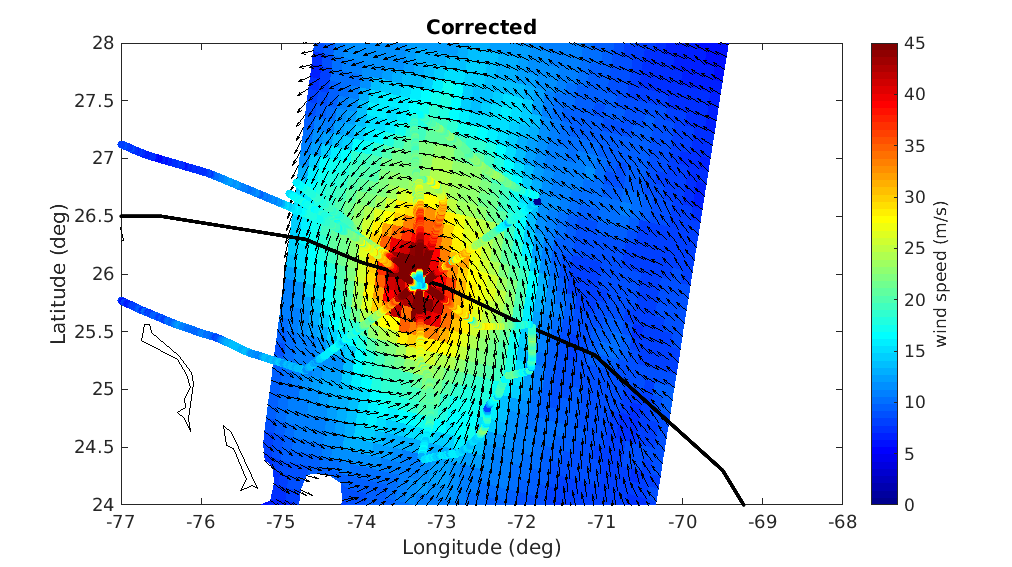
A prerequisite for a successful development of a multi-mission wind dataset is to ensure good inter-calibration of the different extreme wind datasets to be integrated in the product. Since the operational hurricane community is working with the in-situ dropsondes as wind speed reference, which are in turn used to calibrate the NOAA Hurricane Hunter Stepped Frequency Microwave Radiometer (SFMR) wind data, MAXSS has used the latter to ensure extreme-wind inter-calibration among the following scatterometer and radiometer systems: the Advanced Scatterometers onboard the Metop series (i.e., ASCAT-A, -B, and -C), the scatterometers onboard Oceansat-2 (OSCAT) and ScatSat-1 (OSCAT-2), and onboard the HY-2 series (HSCAT-A, -B); the Advanced Microwave Scanning Radiometer 2 onboard GCOM-W1(AMSR-2), the multi-frequency polarimetric radiometer (Windsat), and the L-band radiometers onboard the Soil Moisture and Ocean Salinity (SMOS) and the Soil Moisture Active Passive (SMAP) missions. In summary, a two-step strategy has been followed to adjust the high and extreme wind speeds derived from the mentioned scatterometer and radiometer systems, available in the period 2009-2020. First, the C-band ASCATs have been adjusted against collocated storm-motion centric SFMR wind data. Then, both SFMR winds and ASCAT adjusted winds have been used to adjust all the other satellite wind systems. In doing so, a good inter-calibration between all the systems is ensured not only under tropical cyclone (TC) conditions, but also elsewhere. This dataset was produced in the frame of the ESA funded Marine Atmosphere eXtreme Satellite Synergy (MAXSS) project. The primary objective of the ESA Marine Atmosphere eXtreme Satellite Synergy (MAXSS) project is to provide guidance and innovative methodologies to maximize the synergetic use of available Earth Observation data (satellite, in situ) to improve understanding about the multi-scale dynamical characteristics of extreme air-sea interaction.